This page was generated on 2016.07.12 by Auto-Redistrict.
vtd_data.txt (tab-delimited)
vtd_data.dbf (dbase/ESRI)


Bernalillo County
McKinley County
Sandoval County
Santa Fe County
Valencia County
VTD district assignments
vtd_data.txt (tab-delimited)
vtd_data.dbf (dbase/ESRI)
Maps (click to enlarge)
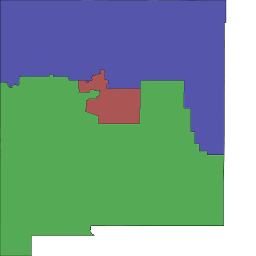
| Districts |  Labeled districts Labeled districts |
 Unlabeled districts Unlabeled districts |
||
| Geometry |  Population difference Population difference |
 Compactness Compactness |
 Splits Splits |
|
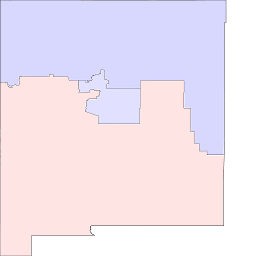
| Fairness - by district |  Partisan vote packing Partisan vote packing |
 Racial vote packing Racial vote packing |
 District vote balance District vote balance |
 District demographics District demographics |
Fairness - by density |  Partisan vote packing Partisan vote packing |
 Racial vote packing Racial vote packing |
 District vote balance District vote balance |
 District demographics District demographics |
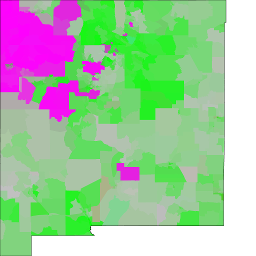
| VTDs |  VTD vote balance VTD vote balance |
 VTD demographics VTD demographics |
 VTD vote balance VTD vote balance(density) |
 VTD demographics VTD demographics(density) |
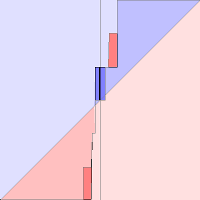
Seats / votes curve - Vote packing


Summary
| Value | Measure |
|---|---|
| 0.4144690750134388 | Compactness (isoperimetric quotient) |
| 0 | Disconnected population (count) |
| 5.678864739 | Population max deviation (%) |
| 2.165814628 | Population mean deviation (%) |
| 6 | County splits |
| 0.022859518 | Seats / vote asymmetry |
| -1,805.098843602 | Packing/cracking asymmetry (%) |
| 96,488 | Competitiveness (victory margin) |
| 0.206837074 | Disproporionality |
| 0.016151280 | Racial vote dilution |
| 14.592767746 | Efficiency gap (pct) |
| 0.437783032 | Adj. efficiency gap (seats) |
| 0 | Undescribed voters |
| 0.0 | FV Safe D |
| 2.0 | FV Lean D |
| 0.0 | FV Tossup |
| 1.0 | FV Lean R |
| 0.0 | FV Safe R |
| 0.673794700 | Mutation rate (%) |
| 33.000000000 | Elitism (%) |
| 0 | Generation (count) |
By party
| Party | Delegates | Pop. vote | Wasted votes | % del | % pop vote |
|---|---|---|---|---|---|
| PRES12_D50 | 2 | 398,923 | 132371 | 0.6666666666666666 | 0.5335292213784563 |
| PRES12_R50 | 1 | 348,783 | 241482 | 0.3333333333333333 | 0.46647077862154374 |
By district
| District | Population | Winner | PVI | Vote gap | Wasted votes | FV Safe D | FV Lean D | FV Tossup | FV Lean R | FV Safe R | Pop per seats | Compactness | Area | Paired edge length | Unpaired edge length | PRES12_D50 vote % | PRES12_R50 vote % | PRES12_D50 votes | PRES12_R50 votes | VAP_WHITE % | VAP_BLACK % | VAP_HISPAN % | VAP_ASIAN % | VAP_HAWAII % | VAP_INDIAN % | VAP_MULTI % | VAP_OTHER % | VAP_WHITE pop | VAP_BLACK pop | VAP_HISPAN pop | VAP_ASIAN pop | VAP_HAWAII pop | VAP_INDIAN pop | VAP_MULTI pop | VAP_OTHER pop |
|---|---|---|---|---|---|---|---|---|---|---|---|---|---|---|---|---|---|---|---|---|---|---|---|---|---|---|---|---|---|---|---|---|---|---|---|
| 1 | 701,807 | 1,0, | D+6 | 32564 | 134730 | 0.0 | 1.0 | 0.0 | 0.0 | 0.0 | 701,807 | 0.30254487970192545 | 9.951253348812029E11 | 6429081.332068501 | 0.0 | 0.5604245528093224 | 0.43957544719067765 | 151,012 | 118,448 | 0.468646260 | 0.023834001 | 0.437698134 | 0.021301253 | 0.000714029 | 0.032708900 | 0.013035709 | 0.002061713 | 250,722 | 12,751 | 234,165 | 11,396 | 382 | 17,499 | 6,974 | 1,103 |
| 2 | 664,094 | 0,1, | R+5 | 23174 | 107301 | 0.0 | 0.0 | 0.0 | 1.0 | 0.0 | 664,094 | 0.5298456282755787 | 1.4450478627976635E13 | 1.0071641400821164E7 | 1.1254836130816376E7 | 0.4460070269615381 | 0.5539929730384618 | 95,714 | 118,888 | 0.450018789 | 0.016452881 | 0.468773042 | 0.007891289 | 0.000652022 | 0.045710571 | 0.009213613 | 0.001287793 | 221,551 | 8,100 | 230,784 | 3,885 | 321 | 22,504 | 4,536 | 634 |
| 3 | 693,278 | 1,0, | D+8 | 40750 | 131822 | 0.0 | 1.0 | 0.0 | 0.0 | 0.0 | 693,278 | 0.4888687482074937 | 1.0115534632128678E13 | 8405290.232518699 | 1.0293119220706787E7 | 0.5772822442384428 | 0.42271775576155723 | 152,197 | 111,447 | 0.439545986 | 0.012864380 | 0.363166407 | 0.011058067 | 0.000553390 | 0.159701871 | 0.011363991 | 0.001745908 | 225,575 | 6,602 | 186,377 | 5,675 | 284 | 81,959 | 5,832 | 896 |
By ethnicity
| Ethnicity | Population | Vote dilution | % Wasted votes | Victory margins | Votes | Straight vote descr. rep. | Target seats | Votes for next seat |
|---|---|---|---|---|---|---|---|---|
| VAP_WHITE | 697,848 | 0.997446960 | 0.128715915 | 43,601.231154470 | 338,740.015290612 | 2 | 2 | 134,405 |
| VAP_BLACK | 27,453 | 0.976513847 | 0.126014594 | 1,681.632975653 | 13,344.747794336 | 0 | 0 | 372,376 |
| VAP_HISPAN | 651,326 | 0.984173410 | 0.127003025 | 39,915.579575891 | 314,288.415588913 | 1 | 1 | 150,962 |
| VAP_ASIAN | 20,956 | 0.993776771 | 0.128242295 | 1,327.142971450 | 10,348.715111629 | 0 | 0 | 373,731 |
| VAP_HAWAII | 987 | 0.987028064 | 0.127371405 | 60.912262770 | 478.225569598 | 0 | 0 | 384,745 |
| VAP_INDIAN | 121,962 | 1.101528778 | 0.142147193 | 8,632.280641176 | 60,727.760318392 | 0 | 0 | 303,168 |
| VAP_MULTI | 17,342 | 1.005503136 | 0.129755528 | 1,101.093718071 | 8,485.909910035 | 0 | 0 | 378,153 |
| VAP_OTHER | 2,633 | 1.008233245 | 0.130107836 | 168.126700519 | 1,292.210416485 | 0 | 0 | 384,024 |
| TOTAL | 1,540,507 | 1 | 0.129045373 | 747,706.000000000 | 96,488.000000000 |
Splits
Bernalillo County
McKinley County
Sandoval County
Santa Fe County
Valencia County